You’ve got 35 islanders and a new episode every day. When friendships can quickly turn into lust and surprising dumpings from production, Love Island is hard to keep up with…
So, I built a dashboard!
Using approximately 205,000 Reddit comments, I explored how audiences talked about the islanders, how those conversations changed episode by episode, and whether any of that discussion could help predict who would stay.
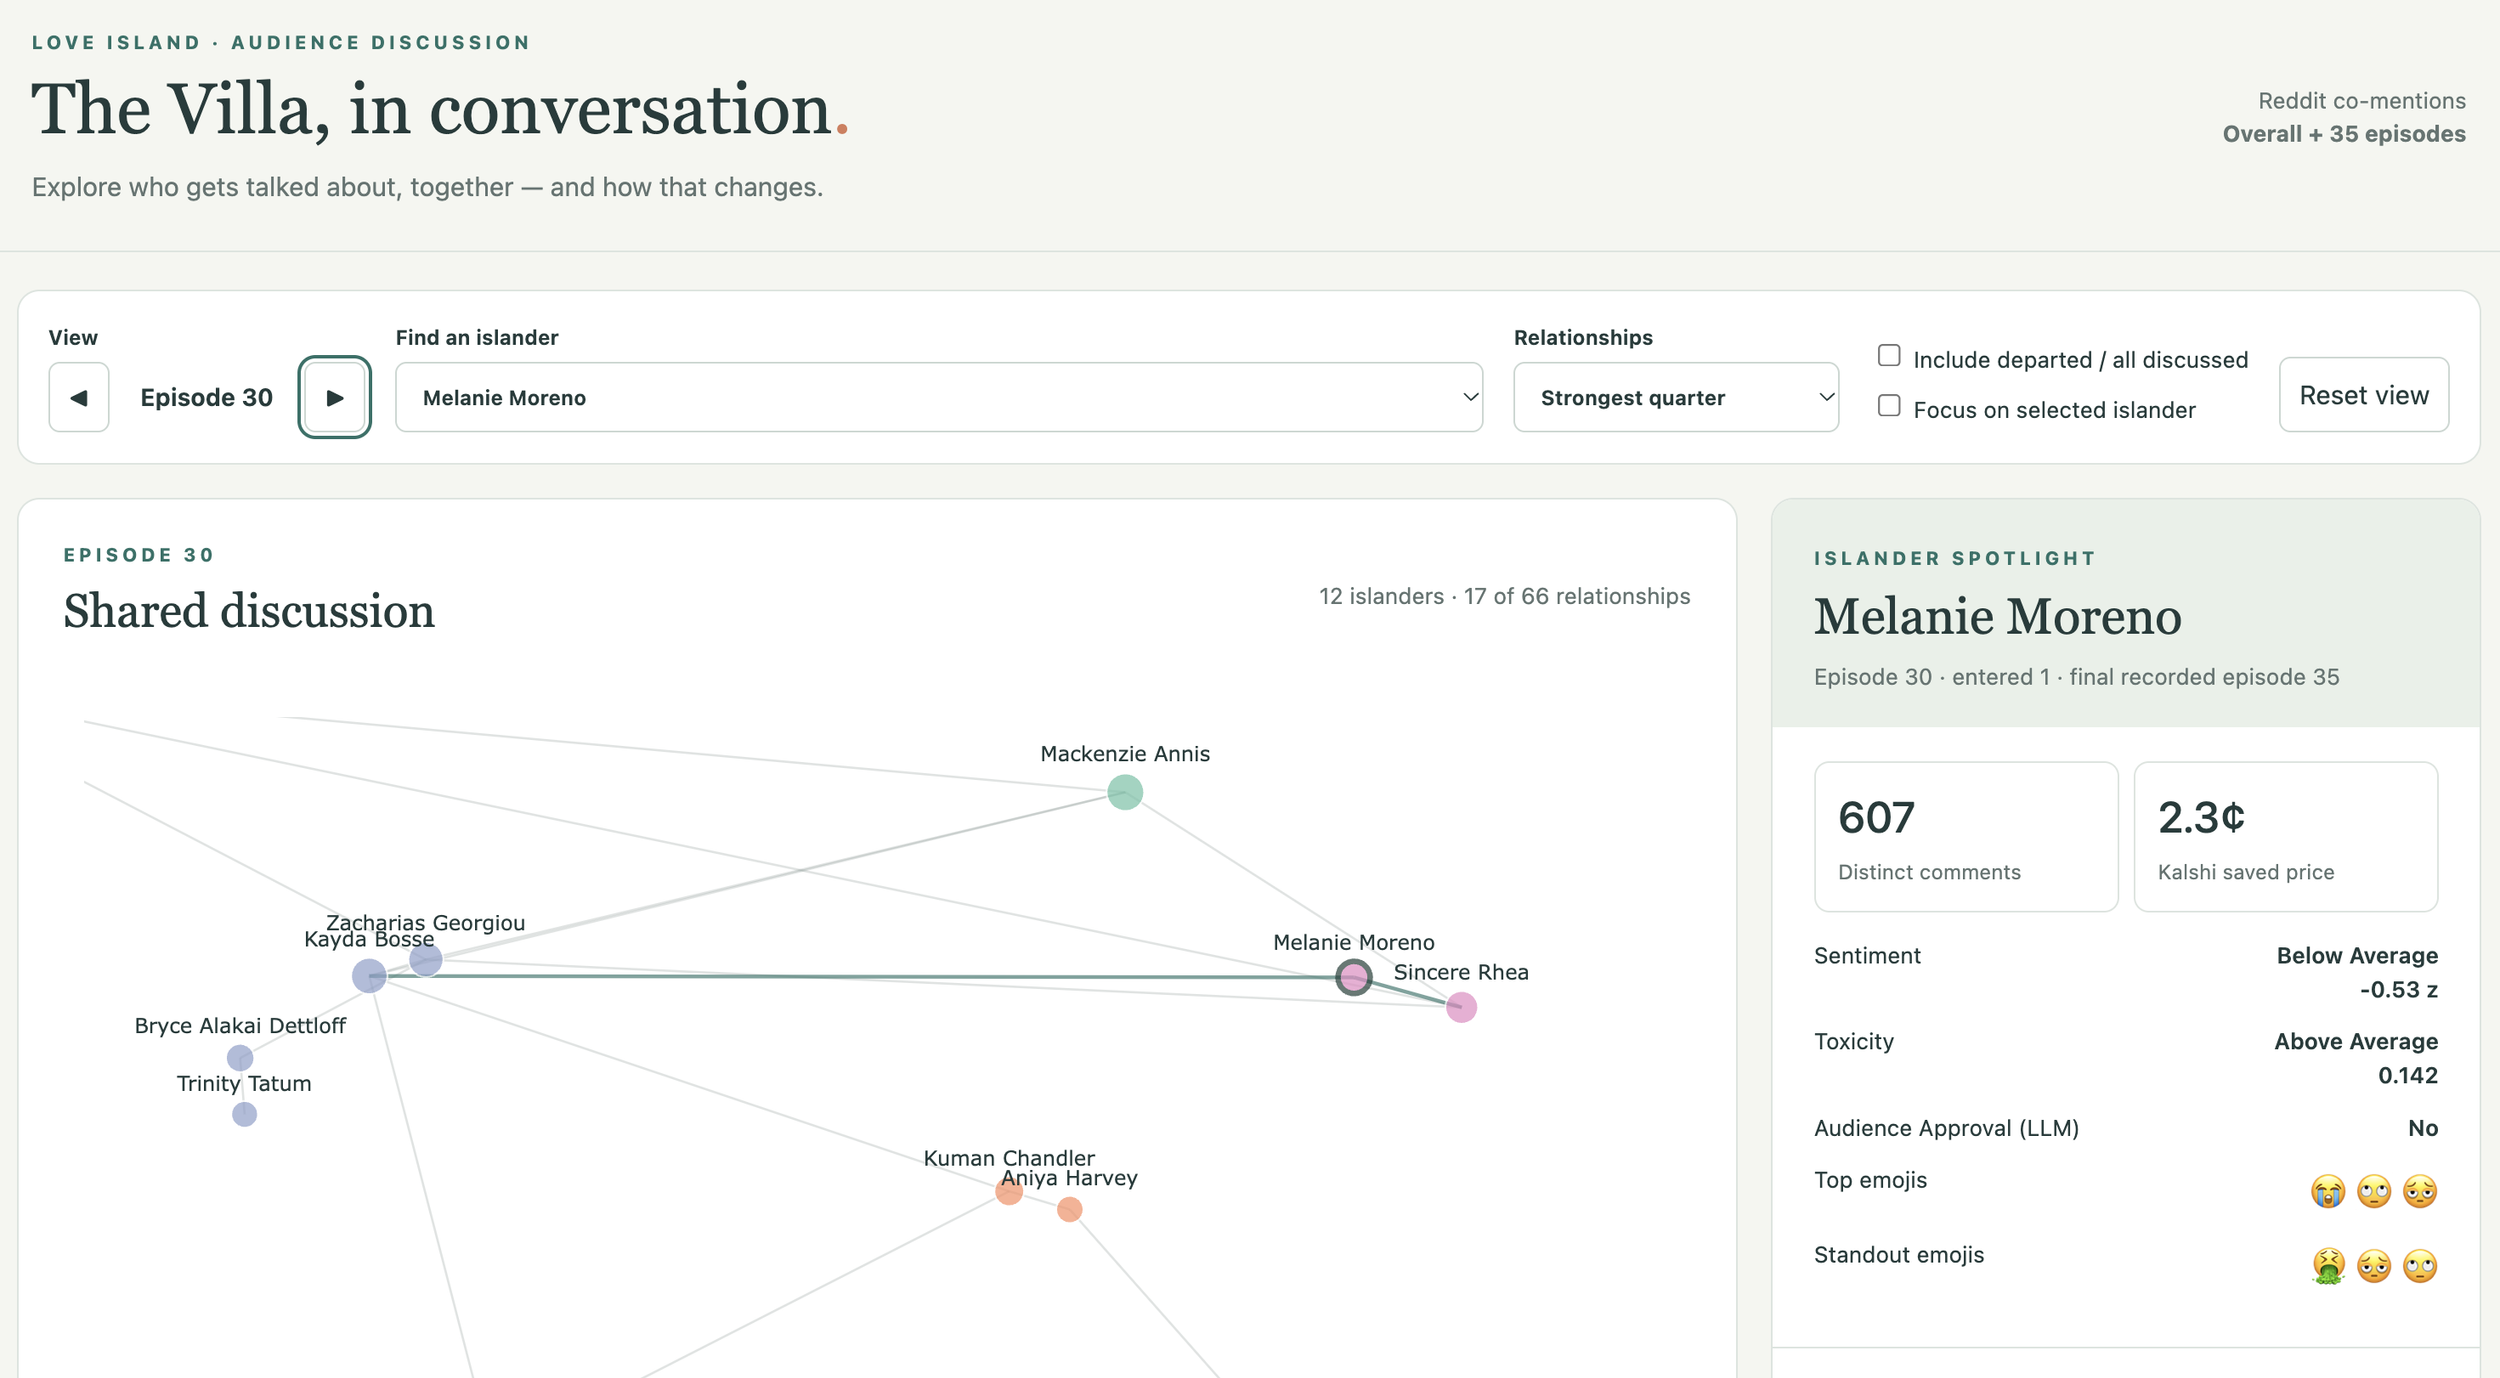
My Love Island S8 dashboard showing episode 30 featuring Melanie Moreno, my favorite contestant. Explore the dashboard here:
https://palautatan.github.io/data-by-edie/004-love-island/viz/dashboard/index.html.
Here for the dashboard? Dive in above by clicking the link.
Curious about how I built it? Let’s look beyond the vibes.
Cleaning the data
I downloaded 205,000 Reddit comments across each episode of Love Island S8. The comments were cleaned and analyzed the language surrounding contestant names for sentiment, polarity, and audience approval using NLP and LLM techniques. I also studied emojis associated with each contestant: which emojis appeared frequently and which distinguished one contestant’s discussion from everyone else’s.
In this study, I assessed the language surrounding a target islander (rather than language specifically, directly about an islander). Contestants were assigned comment excerpts with 15-tokens on each side of islander names. I removed all contestant names from the excerpts.
The dashboard visualizes the measurements into a network where you can select an episode, click an islander, and explore their discussion: sentiment, approval, toxicity, emojis, and co-mention connections to other contestants.
The lines connect islanders mentioned together in comments. The thicker the line, the more co-mentions. I also calculated average sentiment for those co-mentions, adding information about the tone of the shared discussion.
Being mentioned together doesn’t necessarily mean being liked together. A comment can praise one islander while criticizing another. The individual language assessments help reveal those differences.
The network colors represent communities identified through Louvain community detection. In plain language, the algorithm looks for groups with relatively strong co-mention connections within them. It doesn’t know who is dating, who are best friends, or who just had an argument. It works from the discussion network.
The dashboard patterns resemble what we watched on screen this summer!
My Takeaways
The Bryce-Trinity and Zach-Kayda community grouping was especially recognizable in the network and especially as a viewer. With two couples and best friendships connecting them, it made sense that their names kept appearing together in comments.
Kenzie’s changing connections were another example. Early on, she was discussed alongside Zach, followed by Sean, Corbin, Gal, and finally, Dylan. Those shifts resembled the romantic storylines unfolding on screen.
The network captures who the audience is talking about together. Watching those connections change episode by episode gives you another way to follow a contestant’s arc.
Melanie whose Love Island experience was shared primarily with Sincere appeared in the most comments in our Reddit dataset. Because of their tumultuous time on the island, the Reddit discourse surrounding them was classified as mostly polarizing per episode meaning they had both loyal fans and haters.
And then there was Trinity Tatum.
Across the measures I explored, emojis, LLM approval, and sentiment around her name, Trinity stood out as an audience favorite. Bryce’s trajectory looked more like a redemption arc.
Zach and Kayda were frequently co-mentioned too, but their language assessments were less favorable than Bryce and Trinity’s. That distinction interested me: islanders can occupy the same discussion community while receiving very different audience reactions.
Attention, approval, and shared storylines are related, but they aren’t interchangeable.
Could the comments tell us who was getting dumped?
The dashboard also includes Kalshi prices, bringing market expectations alongside the Reddit discussion.
In my earlier post, I explored the relationship between sentiment and those prices. For this project, I wanted to ask a different question:
Could the discussion help predict an islander’s final exit?
I explored this question using Kaplan–Meier survival estimates, a Cox proportional hazards model, and logistic regression.
Each model served a different purpose. The Kaplan-Meier model described how long contestants remained before finally exiting. The Cox model examined whether discussion characteristics were associated with departure hazard. Logistic regression used the previous episode’s measurements to predict a final exit in the next episode.
The predictors included sentiment, toxicity, comment volume, and co-mention measures. The logistic model also included episode number and time since entrance.
To evaluate the logistic model, I trained it on earlier episodes and predicted later ones. I compared those predictions with a simpler benchmark: the exit rate observed so far.
While all models are wrong and some prove useful… these models? Not so much.
Logistic Regression
The logistic model was refitted before each episode using only earlier episodes’ outcomes and each islander’s previous-episode discussion metrics. After the initial training period, I evaluated predictions across 314 islander-episode observations containing 22 final exits, using imputation to retain observations with missing predictors.
The model achieved an AUC of 0.34, tending to assign lower departure risks to actual exits than to non-exits. Its probability estimates also performed worse than a simple benchmark based on the exit rate observed so far. Although the NLP data helped describe audience reactions, these predictors did not improve next-episode exit forecasts in this season.
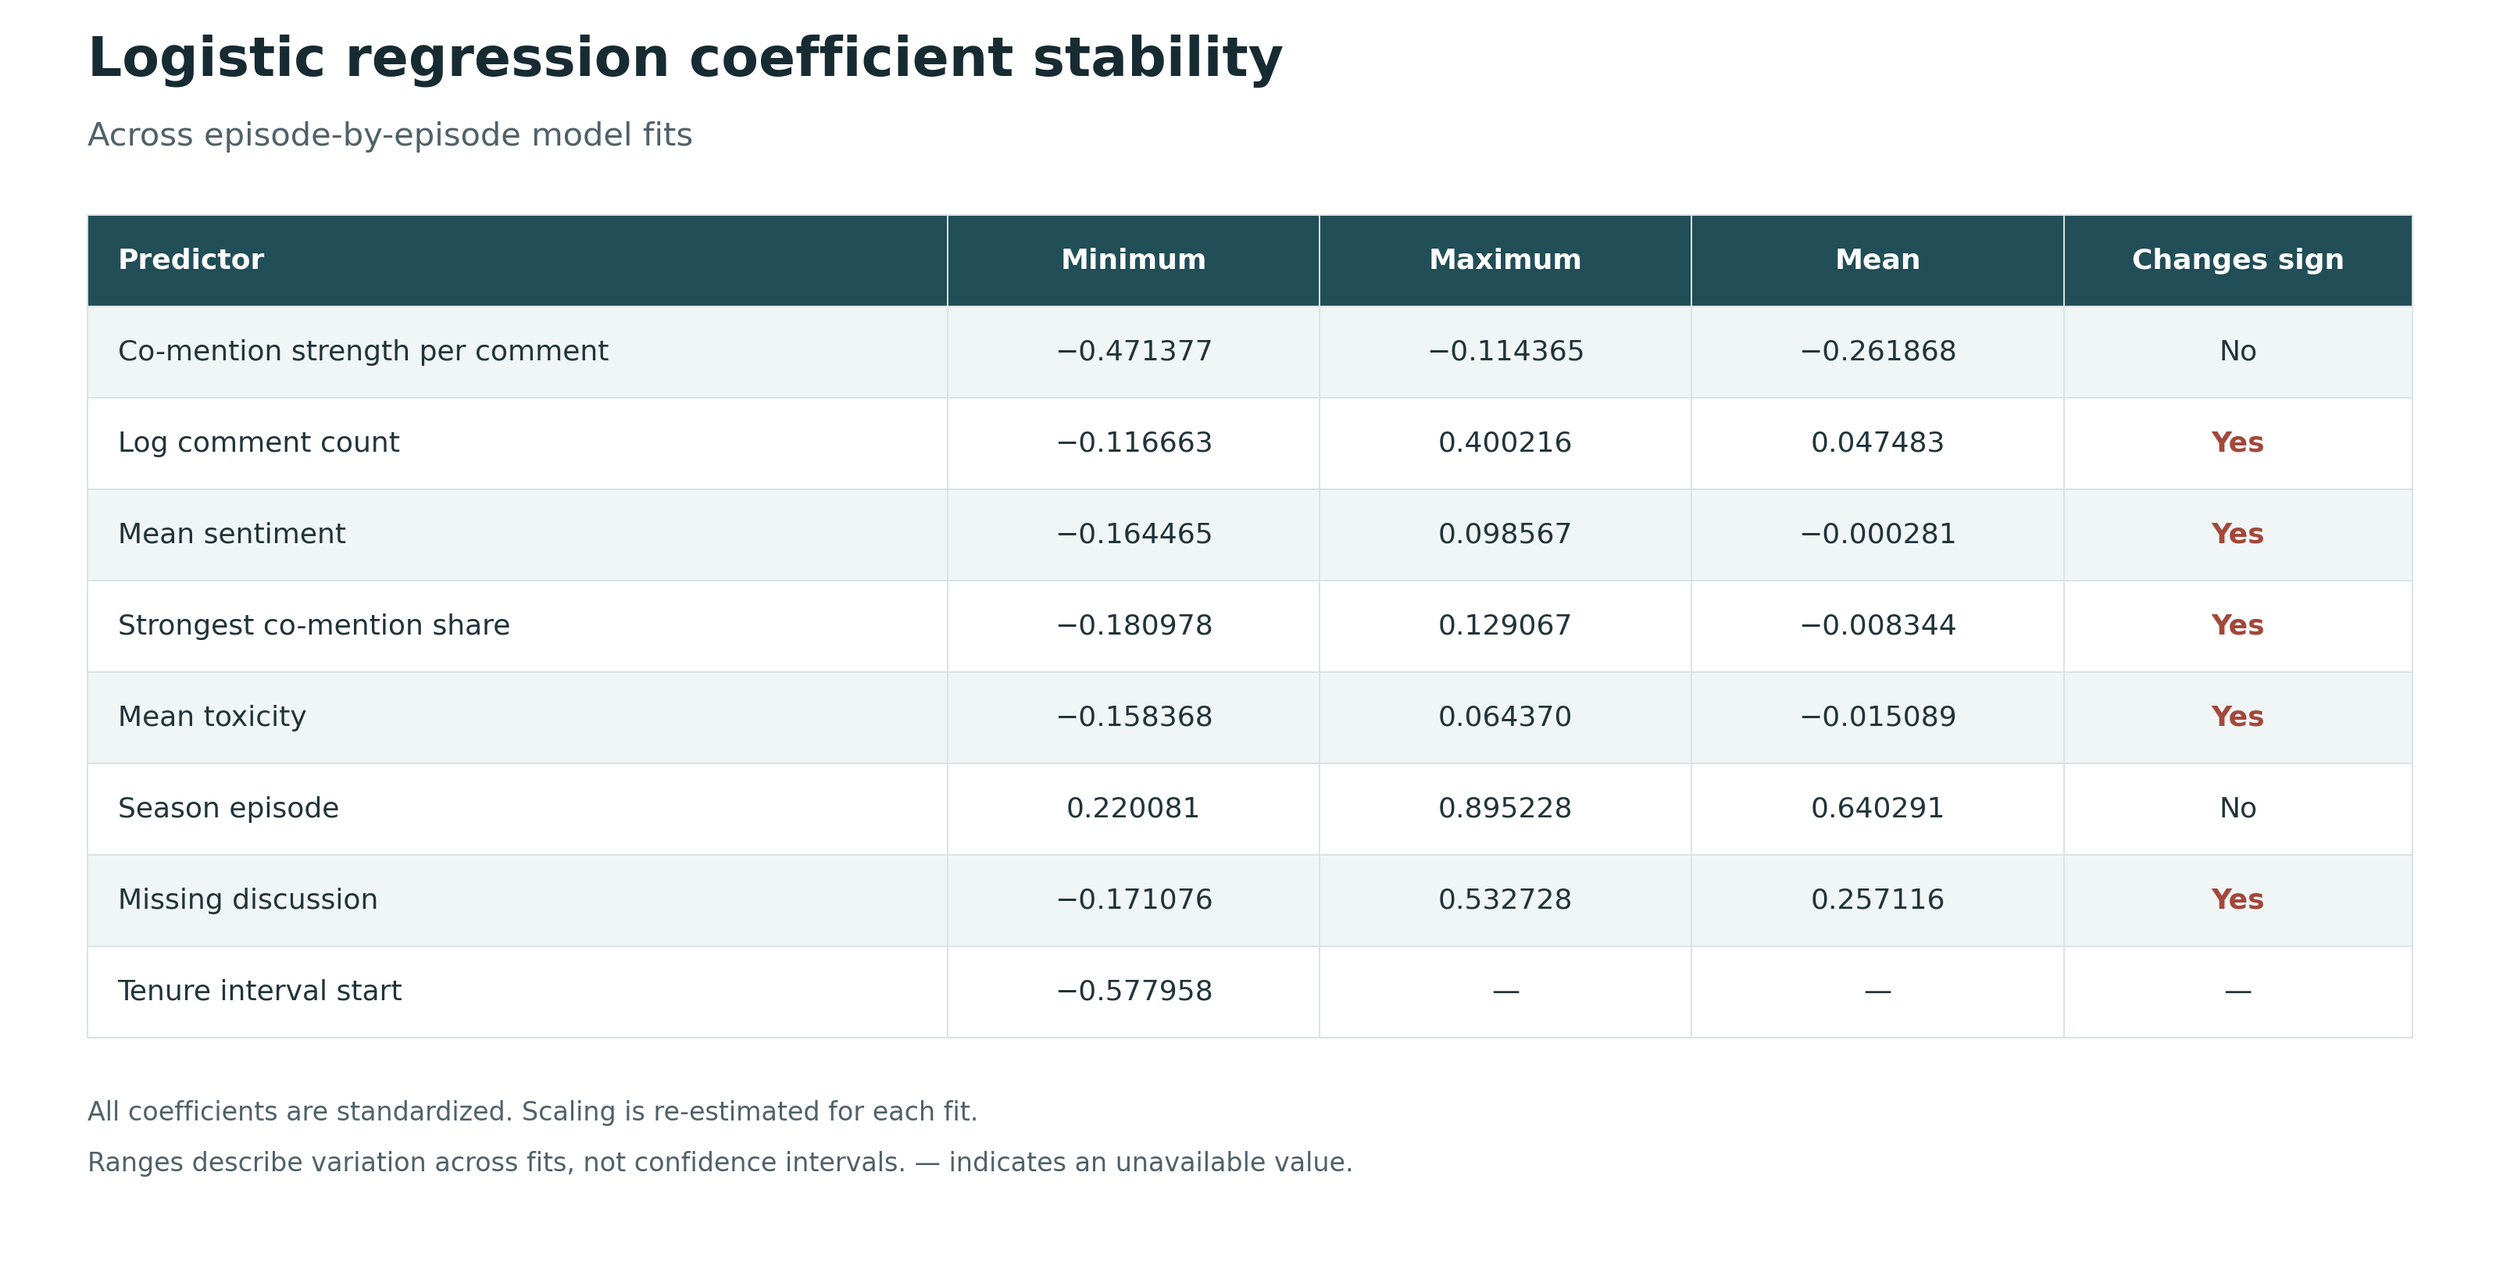
Logistic regression coefficient stability across prediction episodes
As I refit the logistic model episode by episode, most predictors flipped between positive and negative coefficients. Even the direction of their relationship with departure wasn’t consistent across fits.
Cox Regression
I compared two Cox models:
First impressions: using discussion from each islander’s first episode and keeping those measurements fixed.
Keeping up with the islanders: updating the measurements episode by episode, using the previous episode’s discussion.
The first-impressions model hinted that more discussion, more positive sentiment, and a greater share of comments mentioning an islander’s strongest connection were associated with lower departure hazard. When I let the discussion measurements change over time, the estimates were closer to zero.
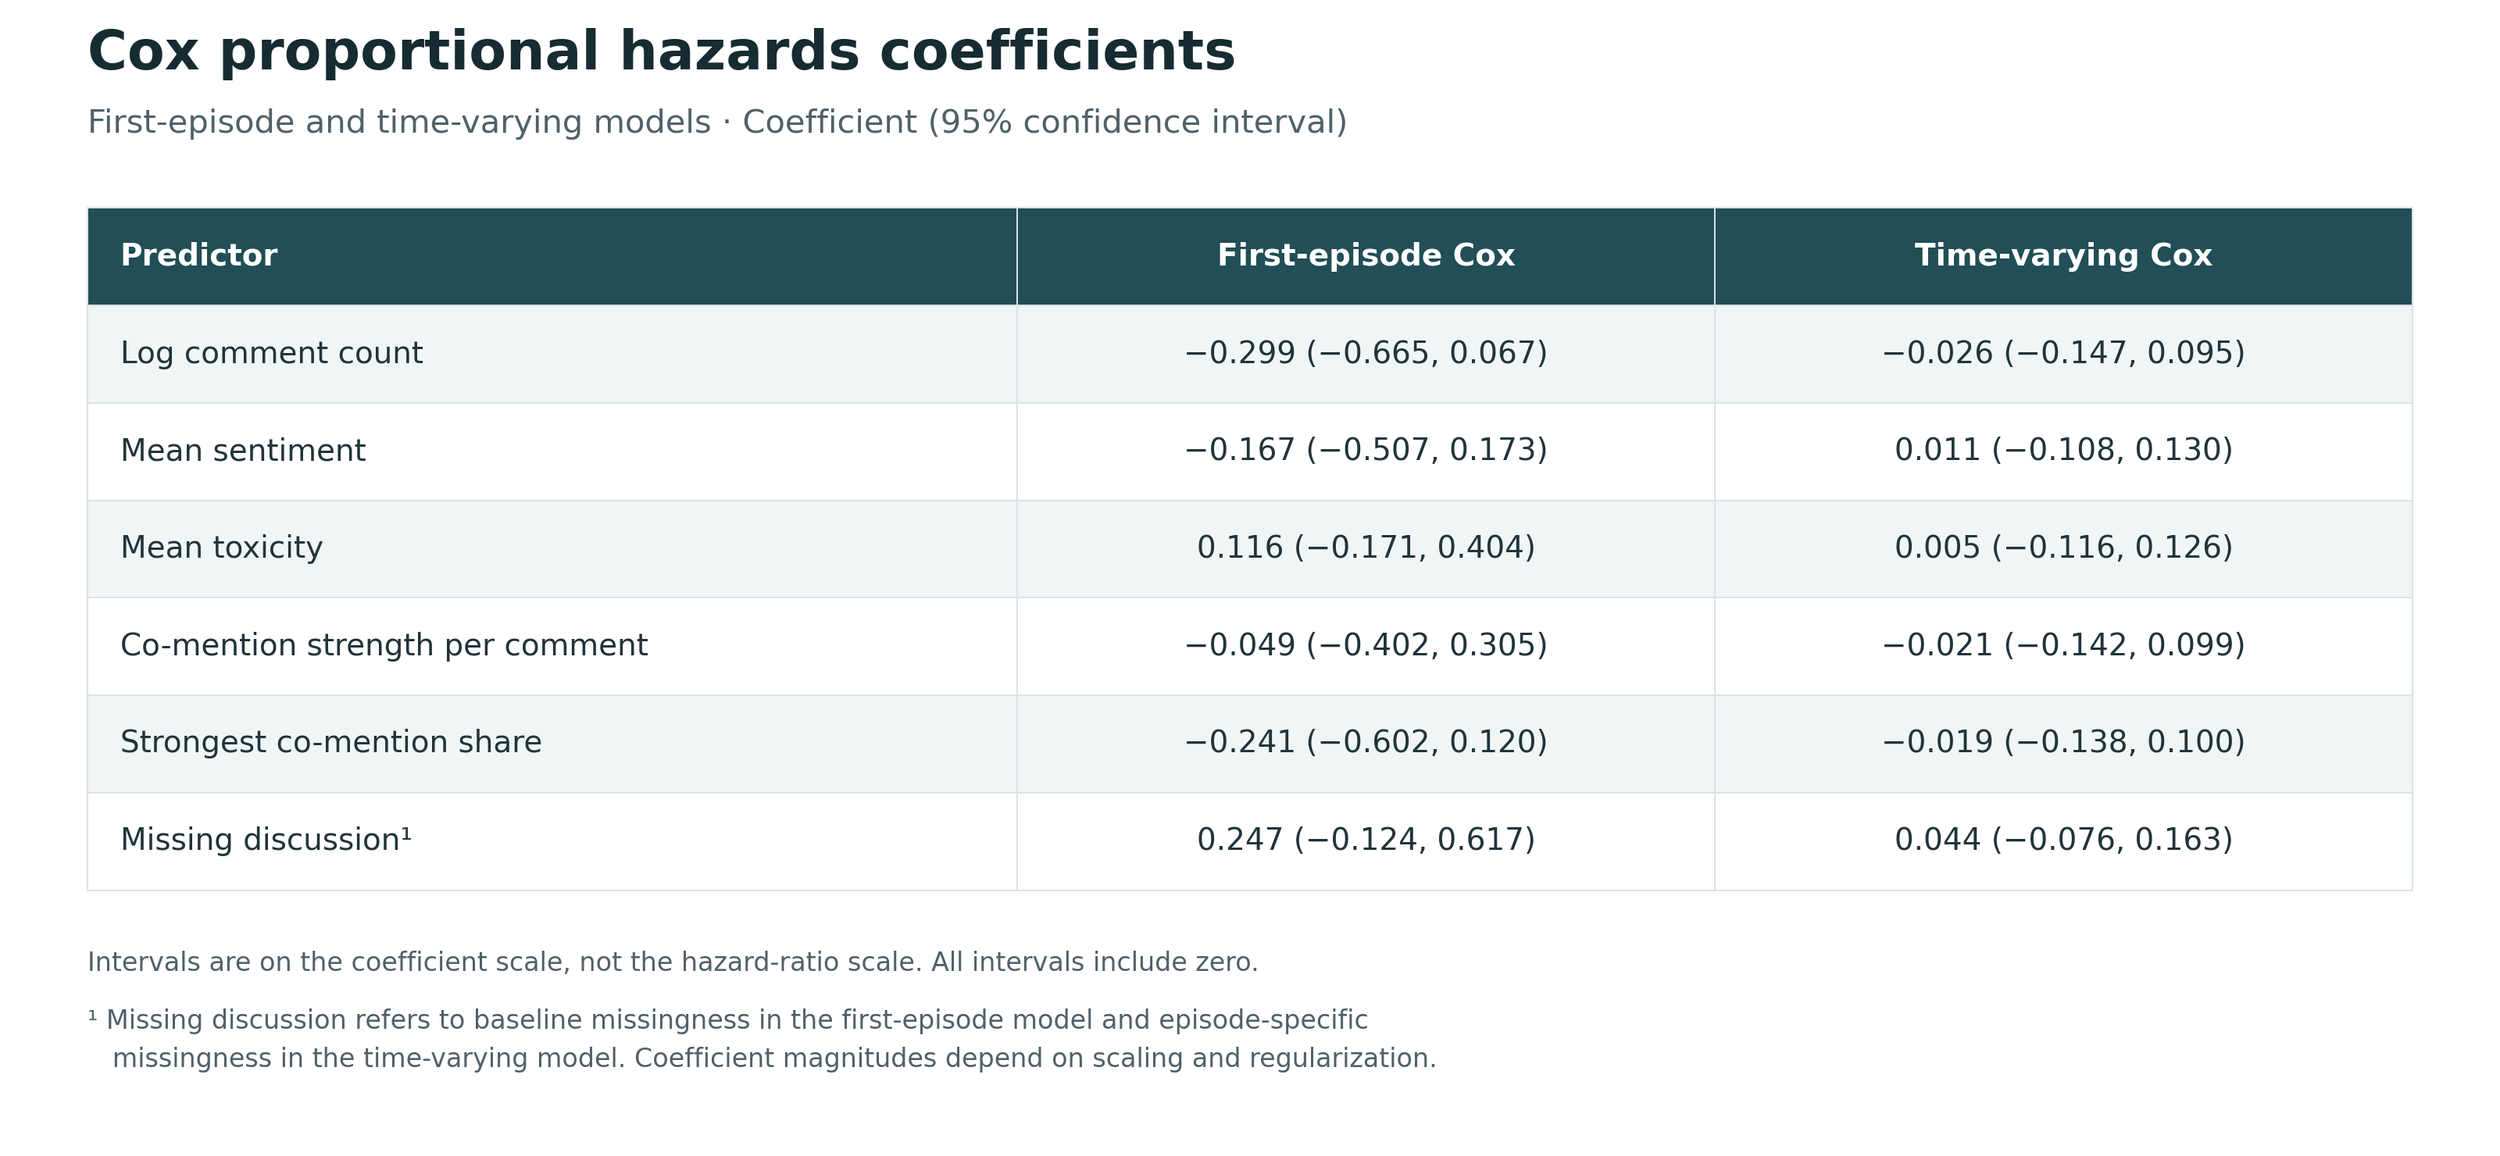
Cox proportional hazards coefficients
For example, in the first-impressions model, a one-standard-deviation increase in log comment volume was associated with an estimated 26% lower departure hazard, holding the other predictors fixed. More chatter, more staying power? Maybe — but the 95% interval ranged from about 49% lower to 7% higher hazard, so I couldn’t draw a firm conclusion.
But every 95% coefficient interval in both models included zero. Some hints? Sure. Clear evidence that these discussion metrics were associated with who got dumped? Not in this season.
I kept these models in the dashboard as exploratory analyses, with their limitations visible. They show the questions I investigated and how model outputs can sit alongside the descriptive data. They don’t provide reliable elimination forecasts.
What if we had more data?
I collected the Reddit data through Apify, which cost money and limited how much I retrieved.
I would have loved to run this analysis on more data! More comments, more complete coverage, more seasons, and more opportunities to validate my procedures.
The modeling cohort contained 34 islanders, 26 observed final exits, and eight finalists whose follow-up ended at the finale. Having 205,000 comments sounds enormous. Having 26 departure events to learn from puts that number in perspective.
Early discussion was also missing for some contestants. Thirteen of the 34 islanders lacked the baseline language and connection measures used in the Cox model, so those values required median imputation.
More seasons could help us investigate whether patterns repeat. Other candidate predictors like screen time, for example, or time-varying social media followings could also be worth exploring.
For now, my results are limited to one season and this particular collection of discussion.
Living on island time?
The analysis follows the show episode-by-episode.
But people don’t watch or comment on the same schedule. Some watch immediately. Others catch up later, including a friend of mine who decided to binge watch the whole season in one week! Anyway, lining comments up by episode doesn’t mean everyone was at the same point in the story. Later replies or spoilers could still bring future information into the discussion.
For the predictive analysis, I used previous-episode measurements and timestamp cutoffs to reduce the use of later information. Those cutoffs are still retrospective approximations. They cannot guarantee that every comment was free of spoilers or perfectly aligned with what viewers knew at the time.
That matters for market comparisons too: the timing of a price observation determines what information it might already contain.
Just a moment can change the audience’s opinion. Episode-level summaries can smooth that moment away.
Redditors are only one part of the audience.
Reddit has its own culture, moderation, recurring jokes, and people who choose to participate. Instagram, TikTok, and Facebook could tell different stories.
Bringing those sources together would be interesting, but it would introduce another set of challenges: different formats, different audiences, and different ways of expressing approval or criticism.
Even within Reddit, language is difficult. Sarcasm, nicknames, comparisons, and comments about several people can complicate an automated assessment. Redditors also tend to use memes and GIFs which I could not analyze directly.
On a sentimental note…
I worked through months of iterations of text analyses methods, including different sentiment models and many LLM prompts. Finally, I used a Twitter DeBERTa sentiment model though I had explored other approaches, including fine-tuning. The fine-tuning route did not work as well as the pre-fit model. Because I worked with text snippets surrounding an islander, I did not perfectly target whether the sentiment I calculated was directly about an islander. A separate LLM assessment of whom each opinion targeted might have improved attribution, but would have added another validation task and API cost.
Finally, the dashboard!
I dreamt of this dashboard. I did.
So I developed the metrics, made the plots, and worked through the analyses. I prototyped in R Shiny.
She is small, but she is nothing mighty.
That version helped me understand what I wanted. But I preferred the plots I was making in Python, and I wanted an interface that brought the network, contestant details, and episode trends together.
So I used Codex to build the custom JavaScript front end.
I did not write that front end myself. I brought the analysis and design direction, then used AI-assisted development to turn those ideas into an interactive dashboard.
I had so much fun with Love Island S8!
Now that it’s been months since I started this project (before Season 8 began), I am excited to say that I have learned a lot.
This project helped me discover how much I enjoy working with free text: finding patterns in messy discussion, combining NLP and LLM assessments, and watching a conversation change over time. This season of Love Island (for me) is finally over… and while I could be a whole lot more sentimental but…
Mama happy.
