What sneakers will you ROC?
Trying to buy a hyped pair of Nikes online can feel impossible.
Among 3.8 million “shoeheads” (sneaker enthusiasts), there was a mere 1.5% win rate on the popular Travis Scott x Air Jordan 1 Low “Reverse Mocha” [1]. To “win” a pair, you have to click through the SNKRS app prompts faster than the crowd. Purchasing is made more challenging by bots, used by resellers, that make up 10–50% of purchases [2].
To combat this, SNKRS Bot Protection uses machine learning (ML) to classify buyers:
“Human or Bot”?
Nike claims their model identifies the majority of bots in fairness to their loyal customers [2]. In this data short, we will define a hypothetical ROC curve based on the SNKRS bot protection model.
A Receiver-Operator Characteristic (ROC) curve is a way to evaluate a classifier — here, deciding whether someone is a bot (+) or a human (-). Say we can assign 100 customers a probability of being a bot. If we choose a cutoff of 50%, then any customer with probability higher than that will be blocked.
From there, we can calculate 2 metrics:
Sensitivity: % of bots we block correctly (“true positive rate”)
Specificity: % of humans allowed to purchase (“true negative rate”)
Then, we plot (1-Specificity, Sensitivity) across a sequence of cutoffs (e.g. 0% to 100%) to form the ROC curve.
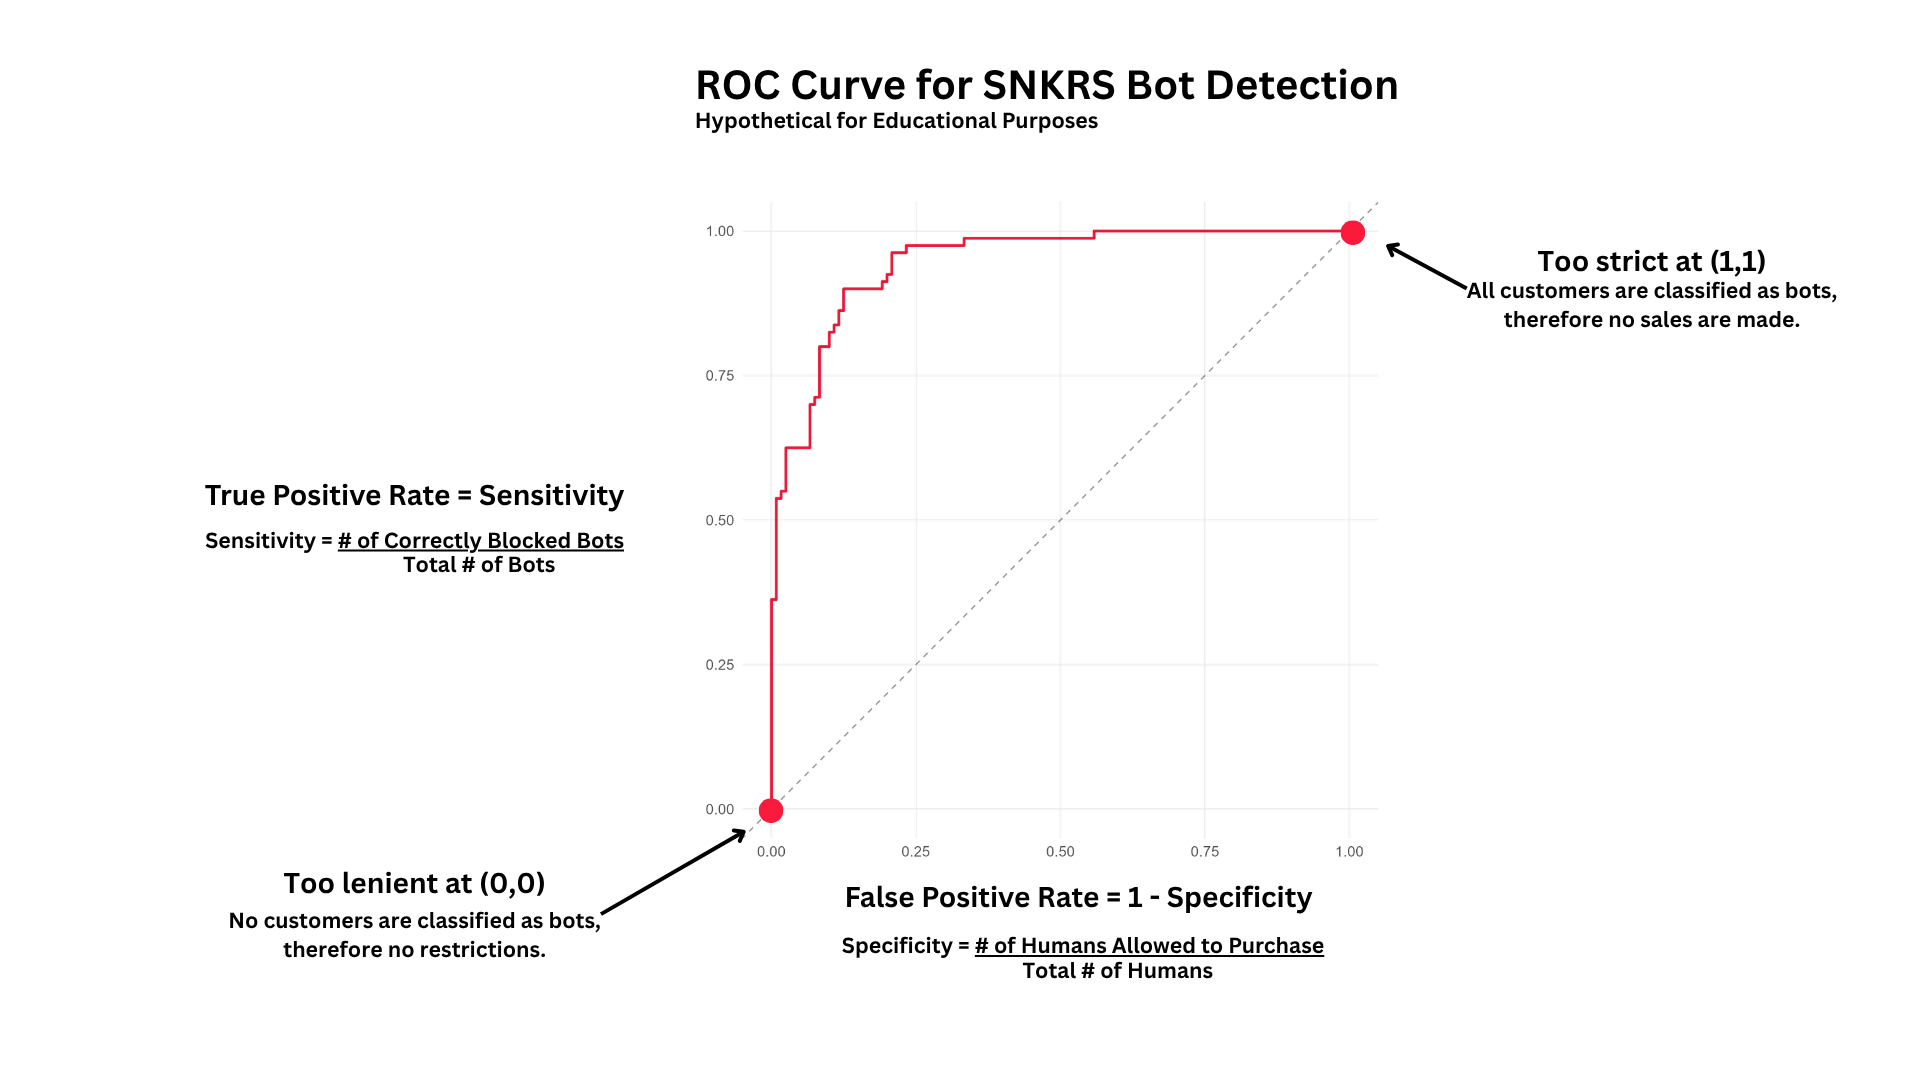
This ROC curve illustrates the trade-off between correctly blocking sneaker bots and accidentally flagging humans as bots. The red line maps a hypothetical ROC curve that Nike’s modeling could have led to.
Understanding the ROC Curve
The ROC curve for Nike’s bot classification model could look like this. Each point on the curve corresponds to a different classification cutoff, from bot chaos at (0,0) to not allowing any sales at (1,1).
#1: Too strict, no one gets sneakers! The point at (1,1) corresponds to predicting all the customers to be a bot.
X-axis: 100% for 1-Specificity which means 0% Specificity. All humans were NOT allowed to purchase.
Y-axis: 100% Sensitivity. Every bot was caught red-handed.
Nike: We stopped the bots! … But we also made no sales?!
#2. Too lenient, no bot protection! The point at (0,0) corresponds to predicting all the customers to be human.
X-axis: 0% for 1-Specificity which means 100% Specificity. All humans were allowed to purchase.
Y-axis: 0% Sensitivity. All bots were allowed to purchase.
Bots: Yay, we bought everything! Time to sell these shoes for the price of rent!
#3. There is a sweet spot in between! Nike claimed they eliminate up to 98% of bots [4], for which they could back-calculate an optimal probability cutoff [3].
Using the ROC curve, we can inspect how changing the threshold for classifications can balance the rate of falsely accusing humans to be bots, or on the flipside, allowing bots right on through to the checkout line.
Getting hyped sneakers is nothing but emotional.
Thrilling if you win, peaceful if you’re a bot owner, and painful for the unlucky. For the “Reverse Mocha,” the retail price was $150, but resale prices quickly soared beyond $1,000. If Nike proactively combats bots with up-to-date models, then there will be a fairer chance shoeheads will get to rock their next new pair soon.
Though, let’s be honest: for the most dedicated collectors, they’ll probably just stay in a clear plastic display box anyway.
Citations and Notes
[1] https://www.nicekicks.com/travis-scott-x-air-jordan-1-low-reverse-mocha-win-rate/
[2] https://www.nike.com/launch/t/inside-snkrs-bot-protection
[3] How to find an optimal probability cutoff/threshold not described here. We will go over that in a future blog!